Code examples
Reconstruction of a simple cell phantom
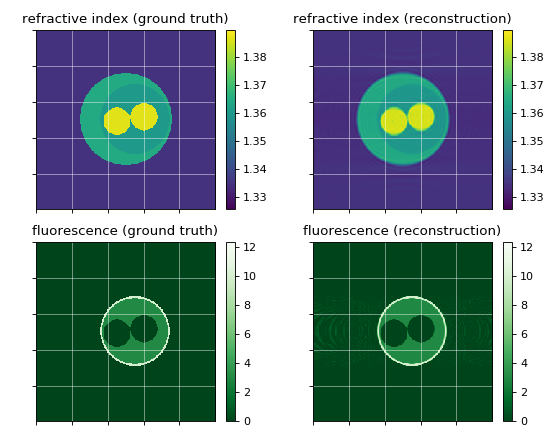
This example uses ODTbrain and radontea for the reconstruction of the refractive index and the fluorescence sinogram of the simple cell phantom. The reconstruction is compared to the ground truth of the cell phantom.
 1import cellsino
 2import matplotlib.pylab as plt
 3import numpy as np
 4import odtbrain as odt
 5import radontea as rt
 6
 7
 8# number of sinogram angles
 9num_ang = 160
10# sinogram acquisition angles
11angles = np.linspace(0, 2*np.pi, num_ang, endpoint=False)
12# detector grid size
13grid_size = (250, 250)
14# vacuum wavelength [m]
15wavelength = 550e-9
16# pixel size [m]
17pixel_size = 0.08e-6
18# refractive index of the surrounding medium
19medium_index = 1.335
20
21# initialize cell phantom
22phantom = cellsino.phantoms.SimpleCell()
23
24# initialize sinogram with geometric parameters
25sino = cellsino.Sinogram(phantom=phantom,
26                         wavelength=wavelength,
27                         pixel_size=pixel_size,
28                         grid_size=grid_size)
29
30# compute sinogram (field according to Rytov approximation and fluorescence)
31sino_field, sino_fluor = sino.compute(angles=angles, propagator="rytov")
32
33# reconstruction of refractive index
34sino_rytov = odt.sinogram_as_rytov(sino_field)
35potential = odt.backpropagate_3d(uSin=sino_rytov,
36                                 angles=angles,
37                                 res=wavelength/pixel_size,
38                                 nm=medium_index)
39ri = odt.odt_to_ri(f=potential,
40                   res=wavelength/pixel_size,
41                   nm=medium_index)
42
43# reconstruction of fluorescence
44fl = rt.backproject_3d(sinogram=sino_fluor,
45                       angles=angles)
46
47# reference for comparison
48rimod, flmod = phantom.draw(grid_size=ri.shape,
49                            pixel_size=pixel_size)
50
51# plotting
52idx = 150
53
54plt.figure(figsize=(7, 5.5))
55
56plotkwri = {"vmax": ri.real.max(),
57            "vmin": ri.real.min(),
58            "interpolation": "none",
59            "cmap": "viridis",
60            }
61
62plotkwfl = {"vmax": fl.max(),
63            "vmin": 0,
64            "interpolation": "none",
65            "cmap": "Greens_r",
66            }
67
68ax1 = plt.subplot(221, title="refractive index (ground truth)")
69mapper = ax1.imshow(rimod[idx].real, **plotkwri)
70plt.colorbar(mappable=mapper, ax=ax1)
71
72ax2 = plt.subplot(222, title="refractive index (reconstruction)")
73mapper = ax2.imshow(ri[idx].real, **plotkwri)
74plt.colorbar(mappable=mapper, ax=ax2)
75
76ax3 = plt.subplot(223, title="fluorescence (ground truth)")
77mapper = ax3.imshow(flmod[idx], **plotkwfl)
78plt.colorbar(mappable=mapper, ax=ax3)
79
80ax4 = plt.subplot(224, title="fluorescence (reconstruction)")
81mapper = ax4.imshow(fl[idx], **plotkwfl)
82plt.colorbar(mappable=mapper, ax=ax4)
83
84for ax in [ax1, ax2, ax3, ax4]:
85    ax.grid(color="w", alpha=.5)
86    ax.set_xticks(np.arange(0, grid_size[0], 50))
87    ax.set_yticks(np.arange(0, grid_size[0], 50))
88    ax.set_xticklabels([])
89    ax.set_yticklabels([])
90
91plt.tight_layout()
92
93plt.show()